
Introduction to the Bullish Candlestick
Understanding candlestick patterns is crucial for readers interested in trading and investing. These patterns serve as valuable signals, providing insights into the current state of financial markets. Among the many candlestick patterns, the “bullish candlestick” stands out as a beacon of hope, indicating future opportunities.
In this comprehensive guide, we will delve into the realm of bullish candlestick patterns, with a particular focus on the optimistic “bullish candlestick.” We will explore what it means, how to identify it, and the best indicators to use to maximize its significance in navigating the complexities of finance.
- Introduction of Bullish Candlestick
- Top 5 Types of Bullish Candlestick Patterns
- 1. Hammer Candlestick
- How to Identify a Hammer Candlestick Pattern?
- Best Indicator for Hammer Candlesticks
- 2. Piercing Candlestick
- How to Identify a Piercing Candlestick Pattern?
- Best Indicator for Piercing Candlesticks
- 3. Bullish Engulfing
- How to Identify a Bullish Engulfing Pattern?
- Best Indicator for Bullish Engulfing Candlesticks
- 4. Three White Soldiers
- How to Identify Three White Soldier Patterns?
- Best Indicator for Three White Soldiers Candlesticks
- 5. The Morning Star
- How to Identify a Morning Star Pattern?
- Best Indicator for Morning Star Candlesticks
- Conclusion
Bullish Candlestick Meaning
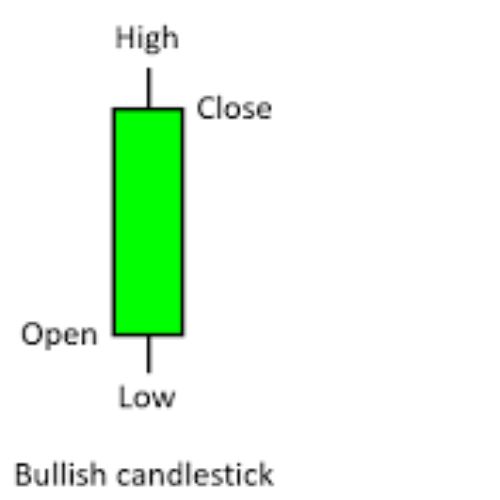
A bullish candlestick is a powerful indicator that offers a simple yet critical insight: the closing price of an asset is higher than its opening price during a specified period. This pattern is frequently depicted by a green or white candlestick, showing optimism in the market and for the stock it represents.
Traders and analysts use a variety of bullish candlestick patterns to collect additional insight into market trends and potential price movements. These patterns can provide important information about the strength of a bullish trend or the possibility of a reversal.
How to Identify a Bullish Candlestick?
Look for a candlestick with a closing price greater than the opening price to identify a bullish candlestick. The colour of the candlestick is commonly green or white, signifying a bullish signal.
Top 5 Types of Bullish Candlestick Patterns
1. Hammer Candlestick
The Hammer candlestick pattern is a bullish reversal pattern that appears at the bottom of a downtrend. This candlestick has a short body with an extended lower wick, similar to its name.
This is one of the most common candlestick patterns and it is often seen in bearish trends. When this chart pattern appears in the market, most traders will wait for the next period to open higher than the previous period’s close
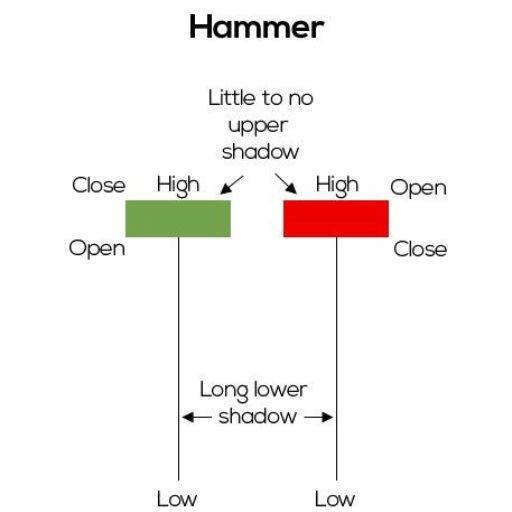
How to Identify a Hammer Candlestick Pattern?
A Hammer candlestick is identified when the closing price is nearly the same as the opening price. The closing price should be close to or greater than the opening price, indicating potential bullish reversal strength.
Best Indicator for Hammer Candlesticks
The Bollinger Bands indicator is a valuable tool for identifying Hammer candlesticks. When the entire candle body is below the lower band, it often signals a strong potential for an upward trend.
In addition, as the width of the bands expands and contracts in response to market conditions, the Bollinger Bands can provide traders with useful information about volatility.
Butler et al. published a method for fitting the parameters of Bollinger Bands using the particle swarm optimization method in 2012. Their findings showed that by tailoring the parameters to a specific asset in a specific market environment, the out-of-sample trading signals improved over the default parameters.
2. Piercing Candlestick
The Piercing candlestick pattern consists of two candles—the first being red and the second green. This pattern emerges within a downtrend.
The Piercing candlestick pattern is a strong bullish reversal signal.
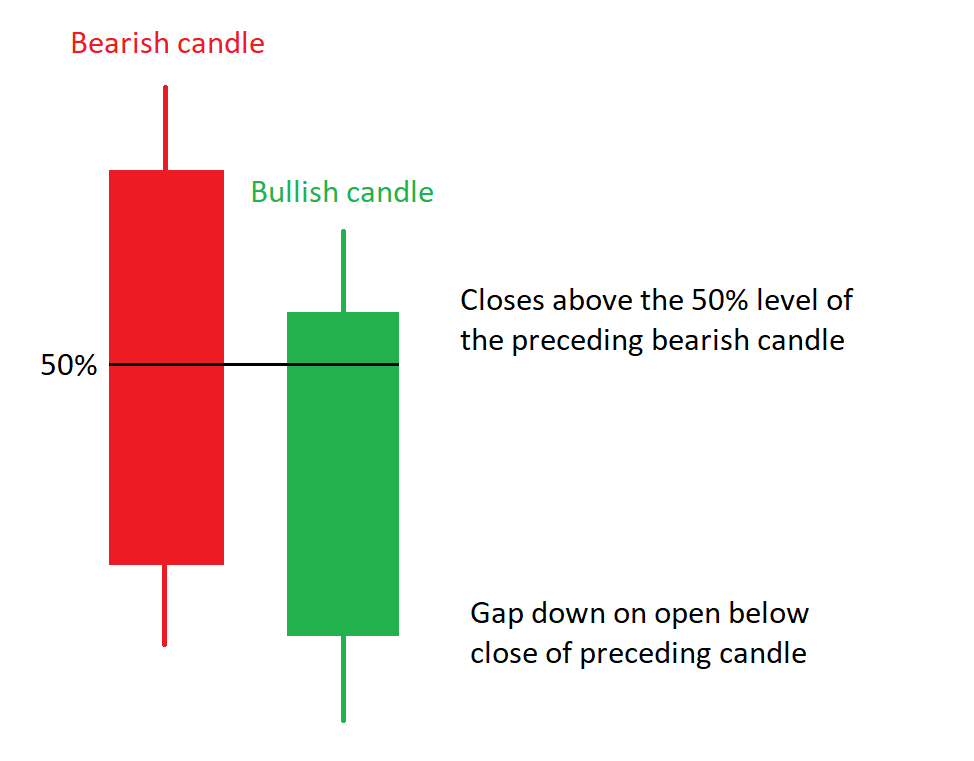
How to Identify a Piercing Candlestick Pattern?
In a Piercing pattern, the green candle must cover more than 50% of the previous red candle’s body. Additionally, paying attention to significant increases in trading volume during this pattern can further validate its strength.
Best Indicator for Piercing Candlesticks
The stochastic indicator is useful for identifying Piercing candlestick patterns as it helps understand overbought and oversold conditions.
To make more informed trading decisions, traders frequently seek alignment between the stochastic oscillator’s signals and the Piercing pattern.
3. Bullish Engulfing
The Bullish Engulfing pattern is a strong bullish reversal signal in technical analysis. It indicates a shift in market sentiment, with buyers greater than sellers, and is frequently regarded as a possible sign of an uptrend.
The Bullish Engulfing pattern shares similarities with Piercing, featuring a red candle followed by a larger green one.
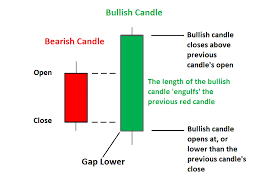
How to Identify a Bullish Engulfing Pattern?
In this pattern, the second green candle entirely engulfs the first red one, considering both body and upper wick. Traders often consider this pattern as a strong reversal signal, particularly when it occurs after a downtrend.
Best Indicator for Bullish Engulfing Candlesticks
To gauge the reliability of a Bullish Engulfing pattern, traders often turn to the RSI (Relative Strength Index) indicator.
Its purpose is to chart a stock’s or market’s current and historical strength or weakness based on the closing prices of a recent trading period. The indicator and relative strength should not be confused.
4. Three White Soldiers
The Three White Soldiers pattern consists of three consecutive long and bullish candlesticks, each with an opening price higher than the previous day’s high.
This formation is a strong indicator of a significant shift in market sentiment, reflecting strong buying momentum and frequently indicating the potential for a significant uptrend.
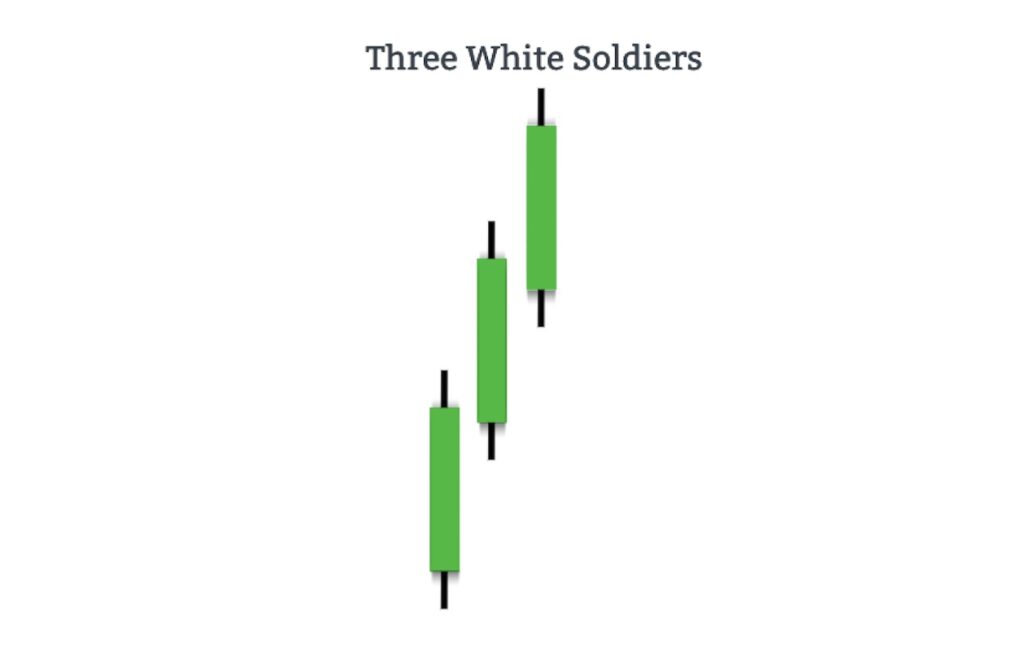
How to Identify Three White Soldiers Patterns?
To identify these three white soldiers patterns, we can use the RSI (Relative Strength Index) indicator.
Traders should look for three consecutive bullish candles with increasing closing prices, as well as an upward trending RSI, to confirm the strength of the bullish momentum.
Best Indicator for Three White Soldiers Candlesticks
Traders often rely on the RSI indicator for spotting Three White Soldiers patterns. This is a popular choice among traders for identifying Three White Soldiers candlestick patterns due to its ability to measure the strength of a bullish trend.
5. The Morning Star
The Morning Star candlestick pattern is a triple bullish signal, indicating a reversal pattern at the end of a downtrend.
Three candlesticks combine to form the Morning Star pattern. The pattern starts with a large bearish candle, then a small candle with a gap down, and finally a large bullish candle.
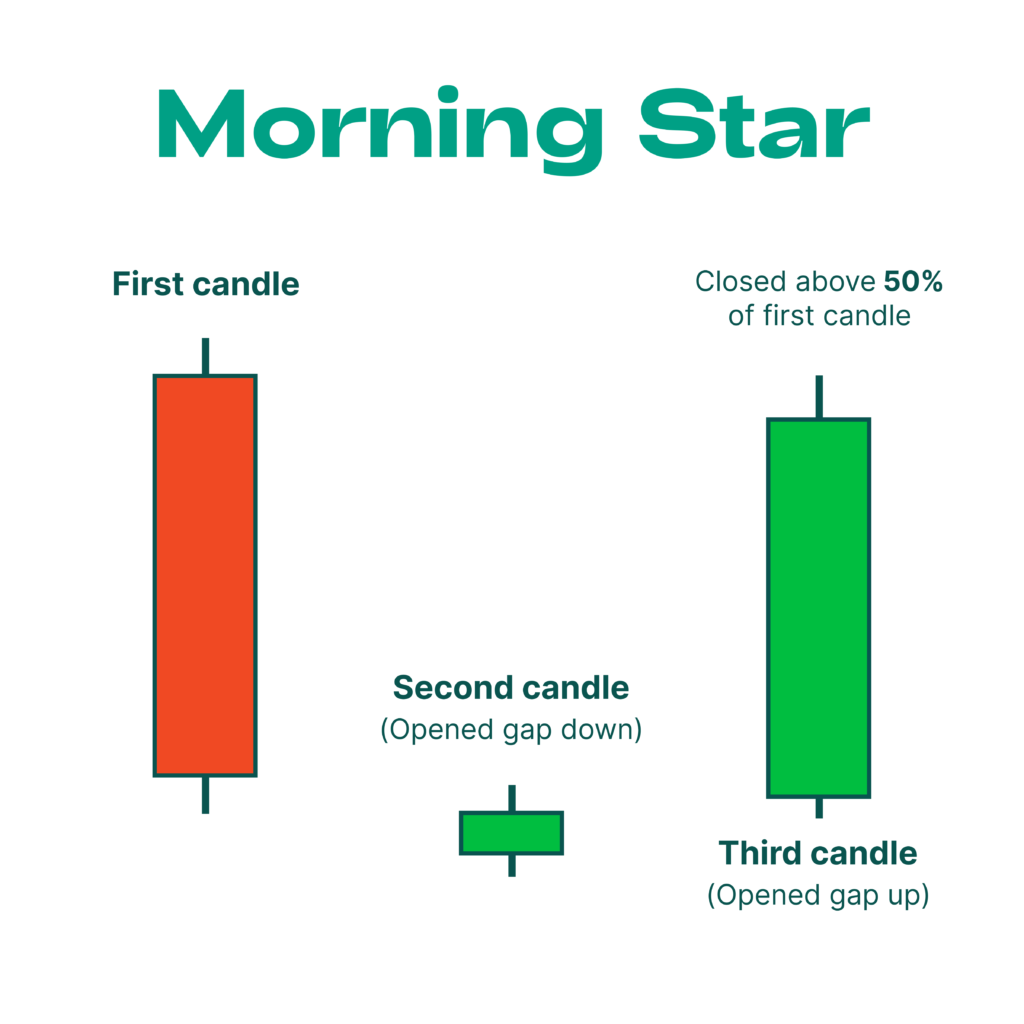
How to Identify a Morning Star Pattern?
It consists of three candles: the first is bearish, the second has a small body (either bearish or bullish), and the third is bullish. Traders often consider it a reliable indicator when analyzing price charts.
Best Indicator for Morning Star Candlesticks
There isn’t a specific indicator for the Morning Star pattern, but it is a significant sign of potential market change.
While there isn’t a specific indicator tailored exclusively for the Morning Star, traders often combine it with volume analysis and other technical indicators to validate the reversal signal and enhance their trading decisions.
Conclusion
Understanding bullish candlestick patterns is like having a secret code to decipher what’s happening in the financial world. Whether you’re just starting or have been trading for a while, knowing these patterns can help you make better choices. They give you clues about where prices might be headed. So, remember these patterns and use them to guide your journey in the exciting world of finance.