
Candlestick pattern
Candlestick patterns are an important tool in financial technical analysis. As it allows traders to interpret price-related information quickly and just from a few vertical bars.
Candlestick patterns are extremely useful as they show all four price points (open, close, high, and low) over the time period the trader has specified.
In these patterns, daily price movement data for currencies, derivatives, and securities are displayed.
One candlestick represents a whole day’s worth of price movement.
Currently, there are 42 recognized candlestick patterns that provide a thorough understanding of price movements and market behavior.
What makes these patterns extremely important is that these patterns allow analysts to use historical data to make informed predictions regarding future price changes. That’s what the technical analysis is all about.
In order to understand the candlestick pattern you must first understand where it is positioned in the trading world.
Refer to the below flowchart to get a clear understanding;
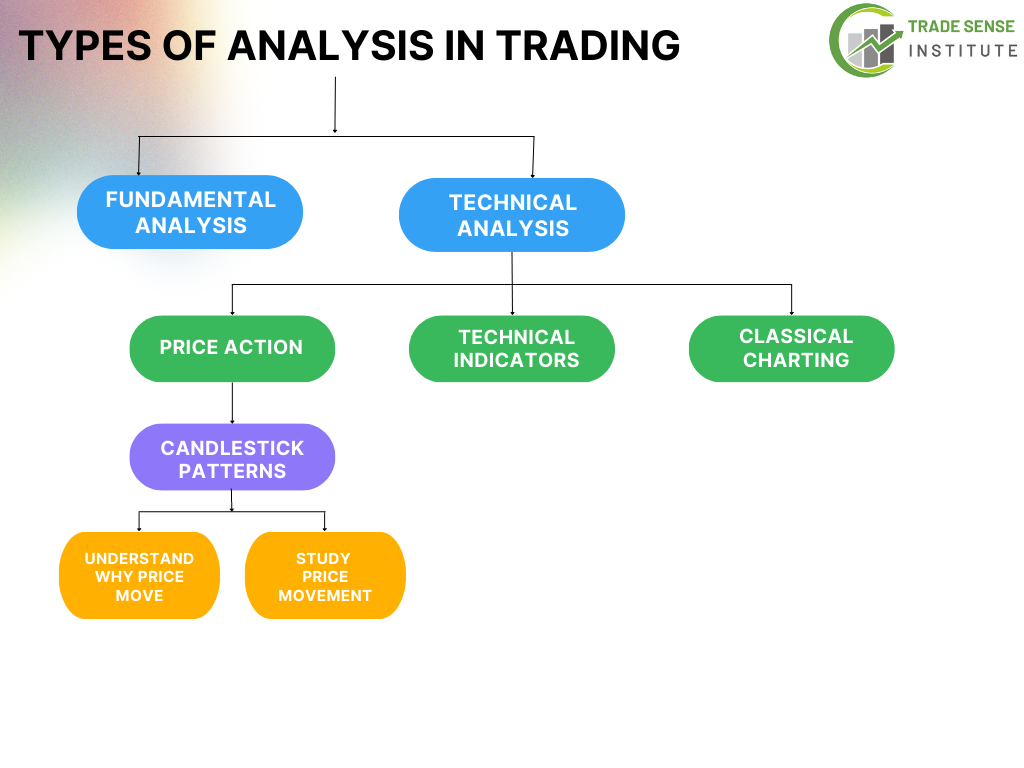
Types of analysis in trading
Fundamental analysis and technical analysis are the two primary categories of stock analysis.
Fundamental analysis
- In fundamental analysis, various factors economic, financial, qualitative, and quantitative factors are considered to assess a stock’s basic value. As both macro and micro economic factors can affect a stock’s value
Technical analysis
The goal of technical analysis is to predict future changes in financial prices based on historical price changes. It can be used for analysis and trading Stocks, indexes commodities, futures, and any other tradable instrument where the price is affected by supply and demand. It includes;
- Price action – Candlestick patterns are a part of price action. where we have to understand price movements, as the price is a leading indicator of future trends.
- Technical indicators- They use mathematical calculations based on past prices, trading volumes, interest data, etc.
- Classical chart patterns- They are used as tools to determine trading positions, and when to enter and exit the market.
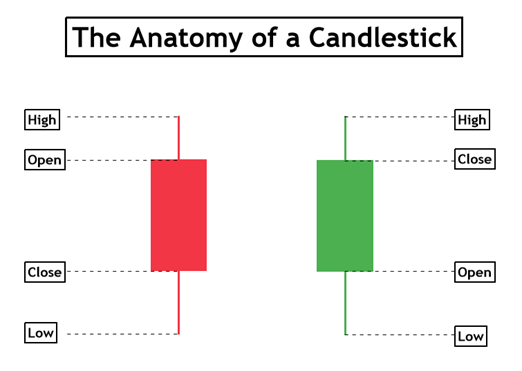
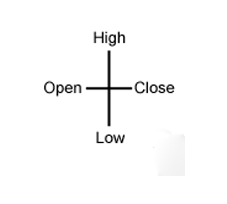
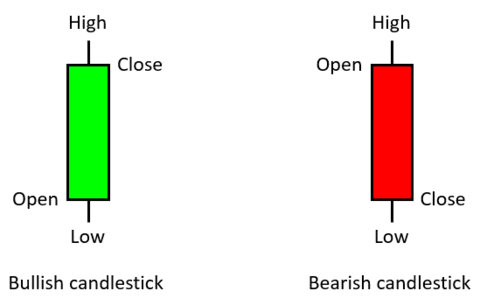
Structure of candlestick
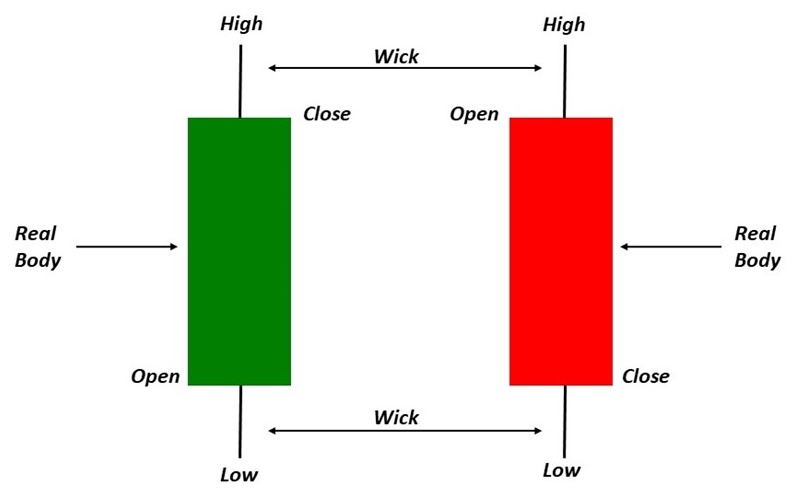
Each candle is a horizontal bar and has three components.
- The Body- The body represents the open and close price of an asset. The open and close price points depend on whether the candlestick is bullish/bearish. In a bearish market, the upper end of the body is the opening price and the lower end is the closing price. In a bullish market, the upper end of the body is the closing price and the lower end of the body is the opening price.
- Shadow/wick- Generally a candle has two shadows or wicks namely upper shadow/wick and lower shadow/wick. The shadow represents the high and low of a price for a time period. So the upper wick represents the highest price and the lowest wick represents the lowest price.
- Color- The color of the candle indicates the direction of the price. Red/black indicates price decline and green/white indicates a rise in price. On most platforms, you will find red and green candles
As mentioned before a candlestick shows all four prices;
- Open-the initial trade made during the time frame indicated by the candle.
- High- It is the highest traded price.
- Low- It is the last traded price.
- Close- The final transaction made during the time frame indicated by the candle
Types of candlestick pattern
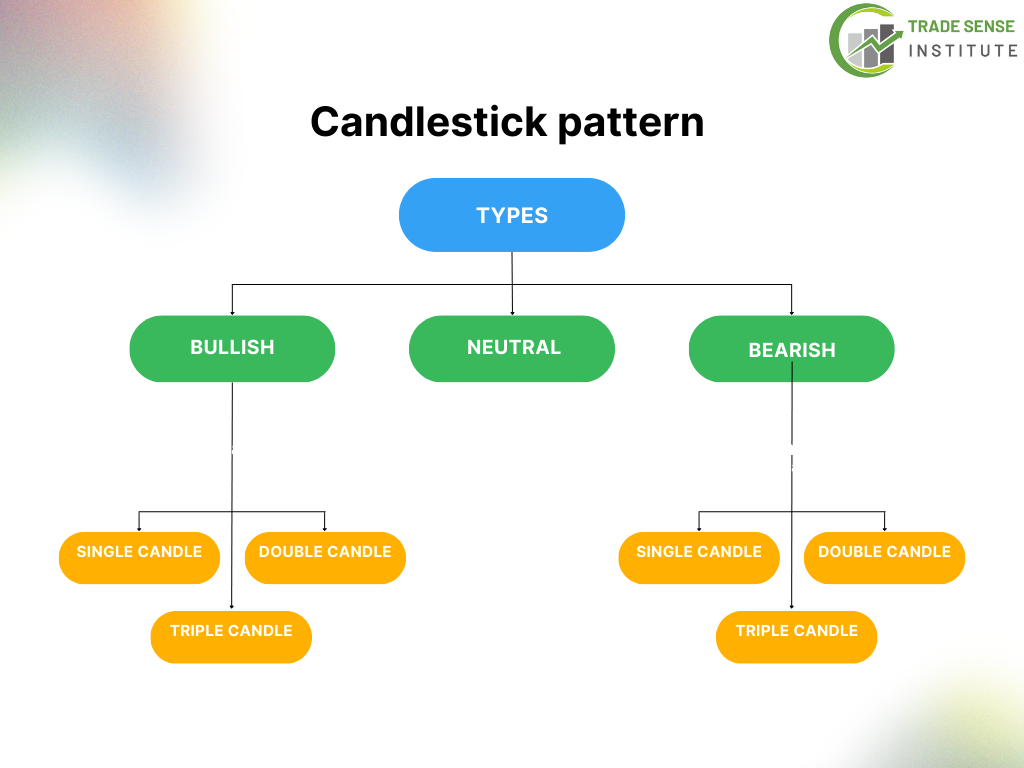
Candlestick patterns can be categorized mainly:
- On the basis of the number of candles
- On the basis of their nature (bullish, Bearish, and neutral)
Identifying the candlestick pattern is really important for traders as it reduces risks associated with the market.
Bullish candlestick pattern
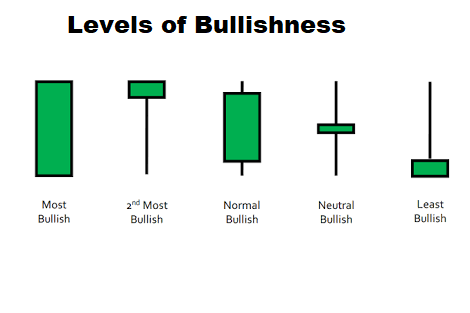
The structure of the bearish pattern comprises:
- Body- It represents the opening and closing price.
- upper wick- It connects the closing and high price.
- lower wick- It connects the opening and the low price
It indicates that the stock is going to show an upward trend. It can occur as a continuation pattern or a trend reversal pattern.
If the bullish continuation patterns appear in uptrends it indicates that the uptrend is likely to continue.
If the bullish reversal pattern appears in a stock that shows a downtrend it indicates that a trend reversal is going to occur. And an uptrend is likely to occur.
Four major bullish candlestick patterns are;
- Hammer
- bullish engulfing
- morning star
- Three white soldiers
Bearish candlestick pattern
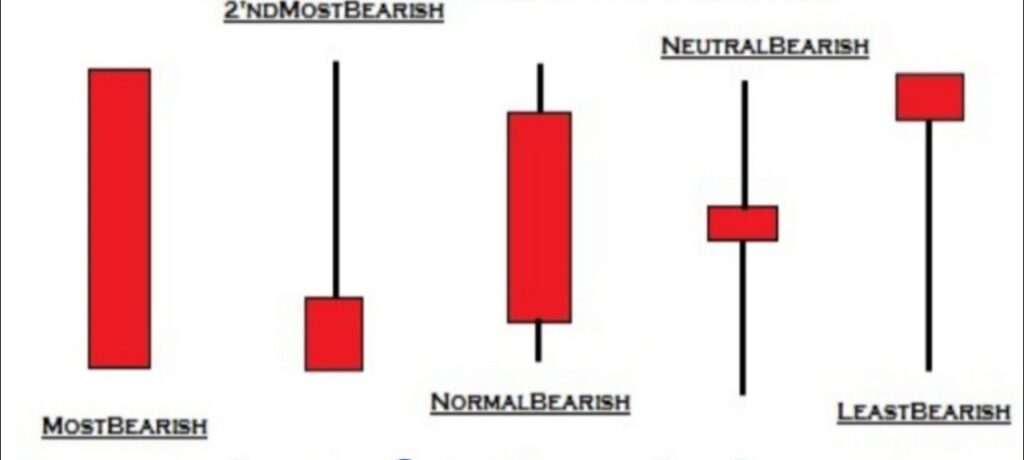
The structure of the bearish pattern comprises:
- Body- It represents the opening and closing price. In a bearish candlestick, the opening price is always higher than the closing price.
- upper wick- It connects the opening and high price.
- lower wick- It connects the closing and the low price
It indicates that the stock is going to show a downtrend. It can occur as a continuation pattern or a reversal pattern.
If the bearish continuation patterns appear in downtrends it indicates that the downtrend is likely to continue.
If the bearish reversal pattern appears in a stock that shows an uptrend it indicates that a trend reversal is going to occur. And a downtrend is likely to occur.
Four major bearish candlestick patterns are;
- Hanging man
- bearish engulfing
- Evening star
- three black crows
Neutral candlestick
A neutral candlestick pattern indicates an uncertain or neutral period for buyers and sellers in the market. The two major neutral patterns are;
Doji
A neutral doji- The body of the neutral Doji is a candlestick with a practically invisible body in the middle and similar-length wicks on the top and bottom.
This pattern will appear when bullish and pessimistic emotions are equally balanced.
Depending on whether the closing price is somewhat higher or lower than the opening price, the pattern can be bullish (white or green) or bearish (black or red).
Spinning top
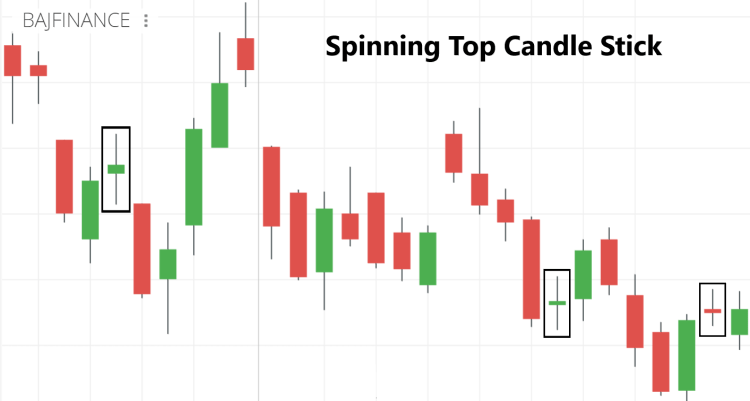
The spinning top pattern consists of a short body between the longer upper wick and lower wick.
It is a neutral pattern as it shows a bullish or bearish trend.
It indicates indecisiveness, so it’s wise to wait before taking any trading actions.
Single candlestick pattern
A single candlestick pattern can last for a minute, an hour, a day, a week, a month, or even a whole year.
The more time that has passed, the more knowledge there will be about upcoming developments and trends.
The top four single candlestick patterns include;
- Hammer pattern
- Inverted hammer pattern
- Hanging man pattern
- Shooting star pattern
Double candlestick pattern
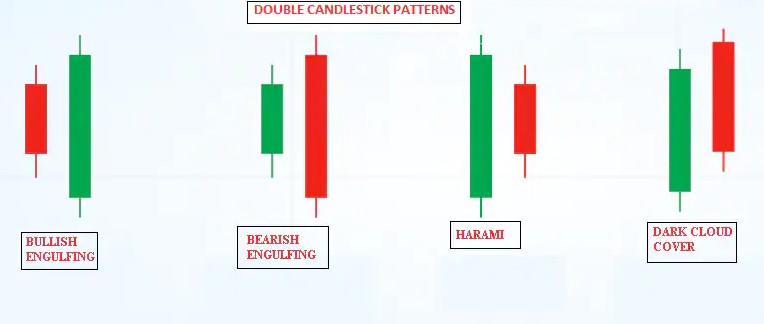
As the name suggests the pattern has two candles, the six major double-candlestick patterns are;
- Bullish engulfing
- Bearish engulfing
- Bullish harami
- Bearish harami
- Dark cloud cover
Triple candlestick pattern
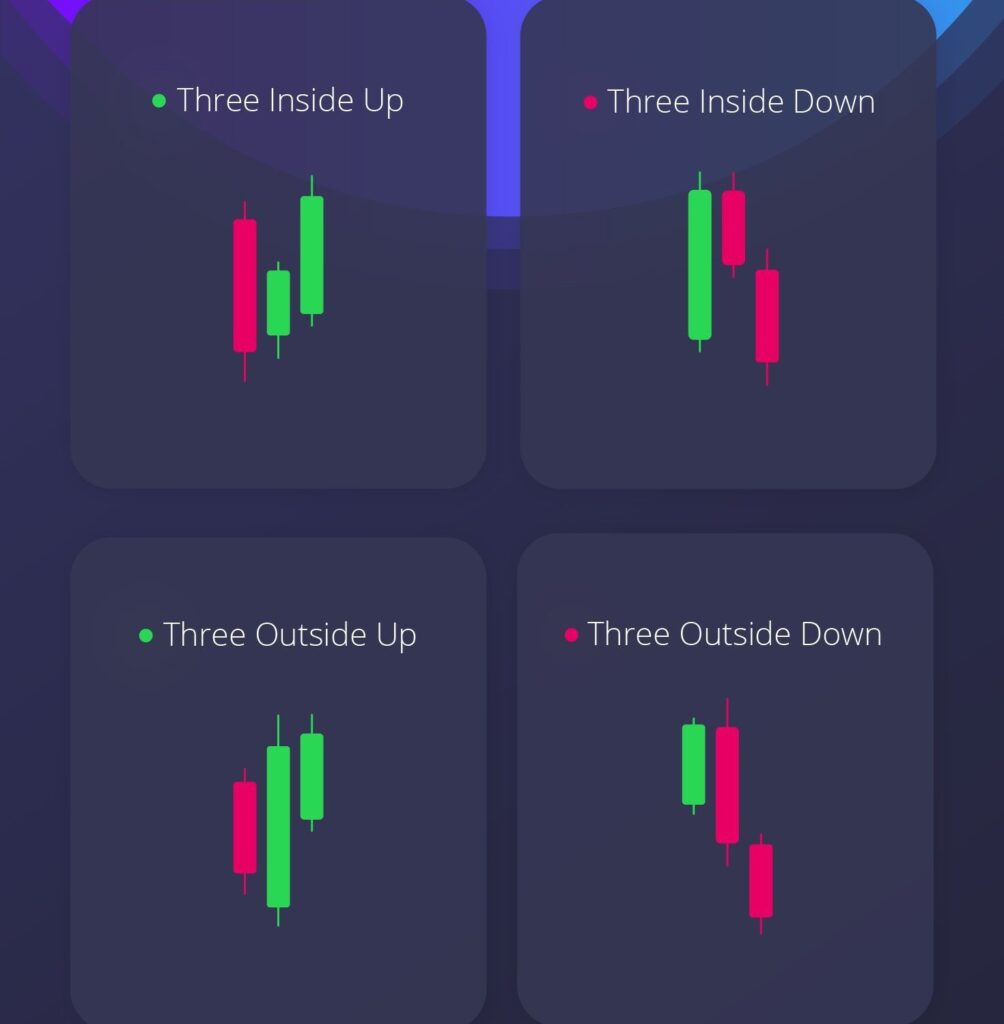
A few of the major triple candlesticks patterns include;
Three inside and outside candlestick patterns;
- Three inside up
- Three inside down
- Three outside up
- There outside down
Pingback: Hammer Candlestick Pattern - Learn Technical Analysis
Pingback: Three outside up/down and three inside up/down candlestick patterns
Pingback: Bullish Engulfing Pattern - Learn Technical Analysis
Pingback: Top 5 Bullish Candlestick Patterns: Meaning and Indicators