
What is a Hammer Candlestick Pattern:
Determining price direction requires in-depth examination and numerous confirmations using trading techniques like candlesticks, price patterns, and trend recognition.
Hammer candlestick meaning: It is one of the most popular patterns in price action trading, used by traders.
Candlestick patterns essentially come under price action trading which is a type of financial technical analysis.
A hammer candlestick pattern is formed when a stock trades much lower than its opening price.
but then surges back close to the opening price by the time the trading period ends.
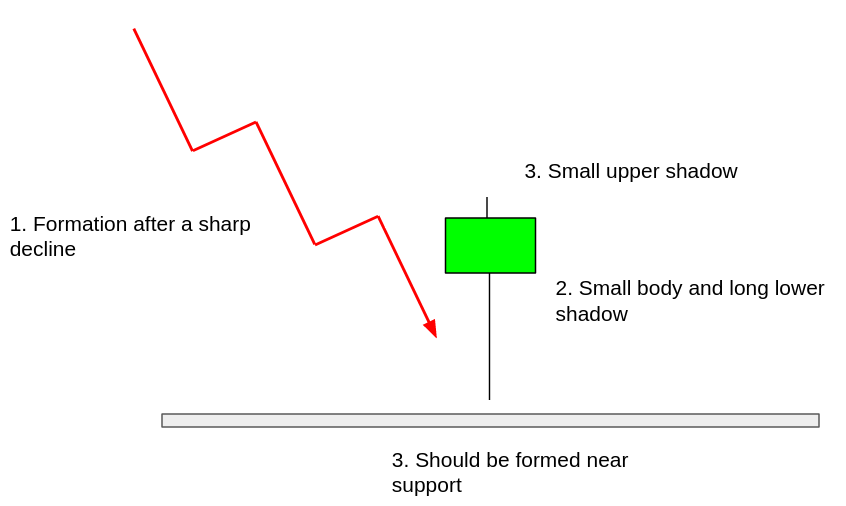
The hammer candlestick pattern is regarded as a reversal pattern mainly bullish reversal which occurs at the end of a downtrend. On the contrary an inverted hammer is a candlestick pattern that looks like an inverted “T” and acts as a bullish reversal pattern.
As the hammer candle is a trend reversal pattern, directional trades can be made using the Hammer candlestick pattern.
Determining price direction requires in-depth examination and numerous confirmations using trading techniques like candlesticks, price patterns, and trend recognition.
How to identify Hammer Pattern:
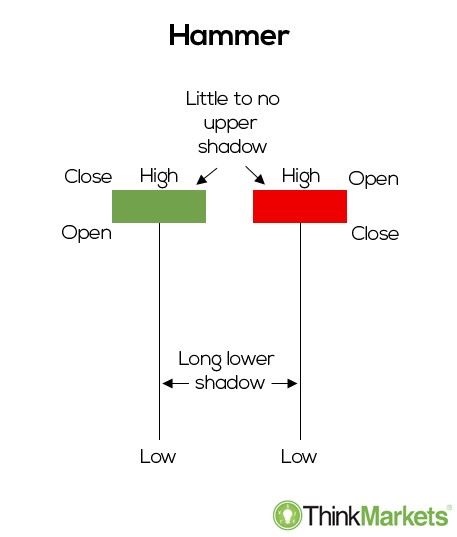
As the hammer pattern is formed when prices increase after a sell-off that occurs throughout the period and closes reasonably near to the open.
Therefore its structure resembles a hammer, with its main body entirely above the trading range for the period.
The color of the main body can be black, white, red, or green.
A hammer candle is confirmed when a lower wick is at least twice the size of the main body.
What are the types of hammer candlesticks?
- Bullish Hammer / Green Hammer
- Bearish hammer/ Red hammer
Bullish Hammer/ Green Hammer:
A bullish hammer or green hammer is a strong bullish sign which indicates the bulls drove the stock’s price above the opening price.
And it is a clear indication that the buyers have overpowered the sellers.
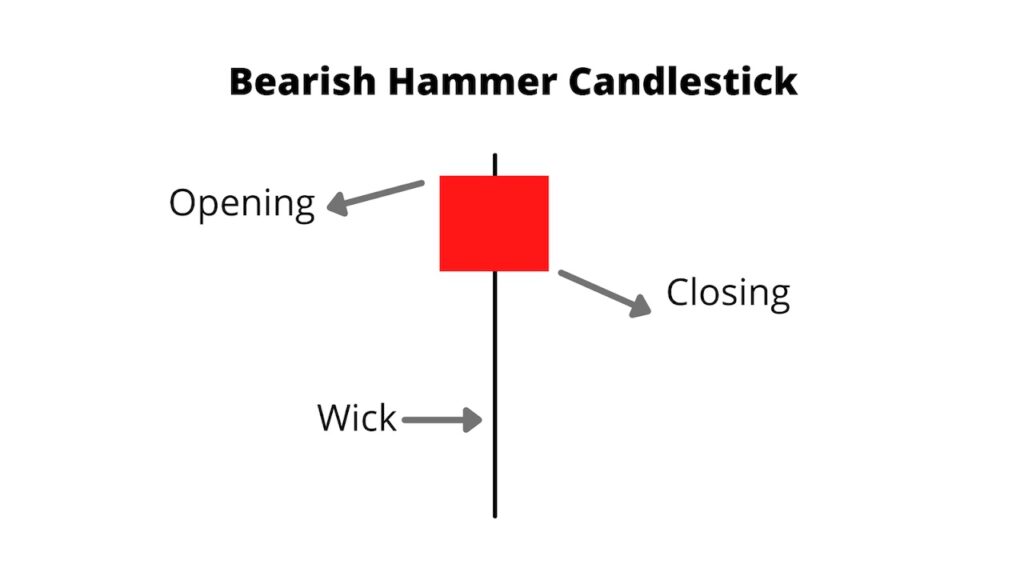
Bearish Hammer/ Red Hammer:
A red hammer or bearish hammer is also a bullish sign and indicates that the bears may still be overcome,
but the bulls could not raise the price back to its opening price.
How does a hammer work in trading?
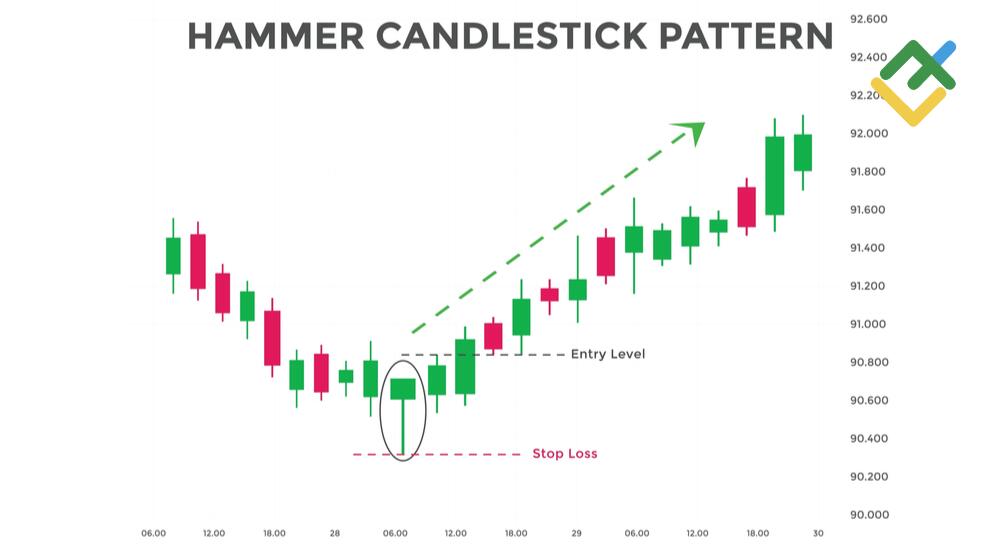
As discussed, the hammer is a bullish pattern indicating purchasing opportunities.
- First, we have to identify its type, whether it’s a bearish hammer or a bullish hammer.
- Once the pattern is confirmed a trader can take an entry level above the high of the hammer and put stop loss below the low of the hammer’s wick.
Related articles:
This article served as a reference for the meaning of the Hammer Candlestick. We describe its meaning, types, and how to trade with it. The following article will teach you single-candlestick patterns related to hammer candlesticks.
Top 4 single candlestick patterns you should know.
Frequently Asked Questions
How accurate is the hammer candlestick?
As discussed, the hammer candlestick is a bullish reversal pattern. And it does what it is supposed to do 60% of the time as discussed by Tom Bukowski in his book Encyclopedia of candlestick charts.
Is a hammer candle bullish?
Yes, the hammer candle is a bullish pattern. And indicates a bullish reversal.
What is hammer candlestick vs doji?
The hammer pattern has a long lower shadow, unlike the doji which has long upper and lower shadows and looks like a plus sign. The hammer pattern signals a bullish reversal on the contrary the doji signals uncertainty in the market. There can be a reversal or a continuation of the ongoing trend.
What is the difference between a hammer and a hanging man pattern?
A hammer pattern indicates a bullish reversal and a hanging man pattern indicates a bearish reversal.
Is a hammer candlestick red or green?
A hammer can be red or green. With green hammer being a strong bullish sign. Red hammer is a bullish sign too but the bulls were not able to raise the stock’s price back to its opening price.
What is hammer candlestick vs doji?
The hammer pattern has a long lower shadow, unlike the doji which has long upper and lower shadows and looks like a plus sign. The hammer pattern signals a bullish reversal on the contrary the doji signals uncertainty in the market. There can be a reversal or a continuation of the ongoing trend
Pingback: What is a candlestick pattern | Guide for beginners - Learn Technical Analysis
Pingback: Bullish Engulfing Pattern - Learn Technical Analysis