
What is a single candlestick pattern?
As the name suggests single candlestick pattern means the pattern contains only one candlestick. It’s used by traders on a one-day candlestick chart.
(TECHNICAL ANALYSIS- This is basically predicting future price movement based on past prices.)
This article will help you learn the structure, buying/sell signal, identification of these patterns, where to put stop loss,
and when a trend reversal is going to occur in all of the following single candlesticks.
WARNING – Keep in mind you can not rely completely on these patterns, other factors play an important role as well.
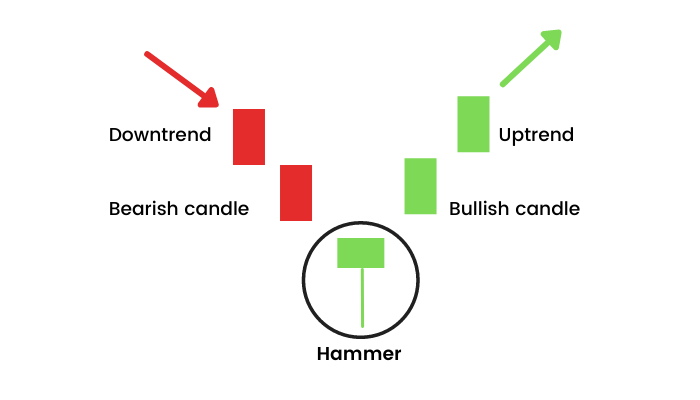
Hammer candlestick pattern.
A hammer pattern is a single candlestick bullish trend reversal pattern that looks like a hammer with a small body and long wick that extends lower.
The wick should be twice the body.
This pattern can be seen at the end of a downward trend.
It is a bullish reversal pattern and suggests the stock has reached the bottom and the trend will reverse.
We have to take a long position above the hammer high and put a stop loss below the hammer low or below the support line.
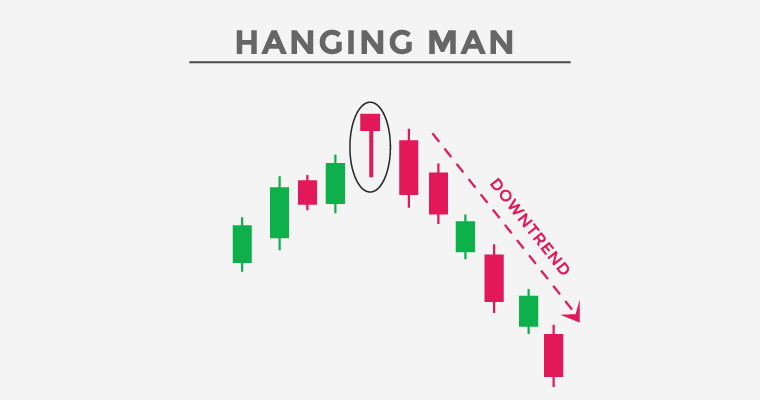
Hanging man candlestick pattern
Another widely used single candlestick pattern is the hanging man pattern, it looks like a hammer with a small body and a long wick that extends lower.
The wick should be twice the body.
The only difference is that the hanging man pattern and the hammer pattern is that the hanging man pattern occurs after an uptrend.
It is a bullish reversal pattern.
In order to confirm the hanging man pattern we have to look at the next candlestick, if it closes below the hanging man low or if a long read heavy volume candle is formed.
You can sell/ short the stock once the next candle stick closes below the pattern’s low and put a stop loss above the high of the hanging man candlestick
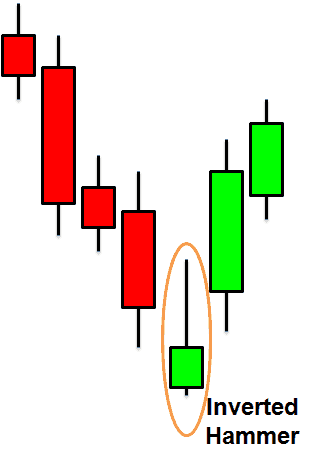
Inverted hammer:
As the name suggests this pattern looks like a hammer placed upside down with a small body and long wick that extends higher.
The wick should be twice the body. This pattern too can be seen at the end of the downward trend.
The inverted hammer candlestick is a bullish reversal pattern.
We have to take a long position above the inverted hammer high or the next candle’s high and put stop loss below the inverted hammer low or below the support line.
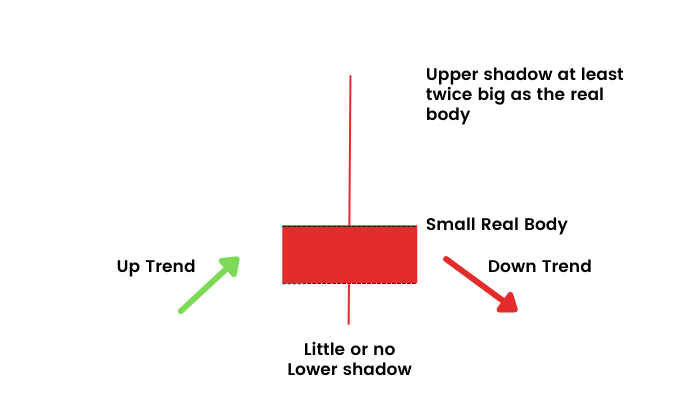
Shooting star :
A shooting star looks like a hammer candle turned upside down. This single candlestick pattern is found at the top of an uptrend.
The wick extends higher instead of lower while open, low, and close are all near the same level.
shooting star pattern too can be seen at the top of an uptrend.
It is a bearish reversal pattern; the longer the wick, the longer the reversal.
In order to confirm the shooting star pattern we have to look at the next candlestick, if it is a bearish candle it will confirm the reversal.
Pingback: what is a candlestick pattern | Guide for beginners - Learn Technical Analysis
Pingback: Hammer Candlestick Pattern - Learn Technical Analysis