
TREND REVERSAL PATTERN.
Appearance of this pattern indicates that the price trend in financial market is going to change and therefore it is called as a trend reversal pattern. It suggests that the market’s trend, which may have been going either up or down, is probably going to change. Technical traders can use these patterns to help them decide whether to purchase or sell a specific security when making investing decisions. There are various types of trend reversal patterns five of which are listed below:
- Morning star
- Evening star
- Bullish engulfing
- Bearish engulfing
- Tweezer bottom
Morning star
Morning star consists of 3 candles;
- Bearish candle
- A small body candle with strong shadows
(The color of this candle does matter)
- A bullish candle should have a length of at least 50% of the first candle.
The morning star candle has 3 types: Doji star, Pinbar star, and Abandoned baby.
This pattern can be seen at the end of the downward trend.
It signals a trend reversal, which is an up trend in the market.
If the morning star pattern is identified we have to take a buy position if the forth candle opens in green. And put stop loss at the bottom of the second candle.
Evening star
The evening star has the same structure as the morning star. But the second candle will be at the top of indecision and it can be bearish or bullish.
This pattern can be seen at the top of an upward trend.
It signals a trend reversal, which is a downward trend in the market.
We can short/sell below the low of the pattern and put the stop loss above the high of the pattern

Bullish engulfing pattern
The bullish engulfing pattern has 2 candles;
- Is a bearish candle
- Is a bullish candle which engulfs the bearish candle
This pattern can be seen at the end of the downtrend.
It signals a trend reversal, which is an up trend in the market.
It also appears in uptrends sometimes.
We have to take a long position above the high of the bullish candle and put a stop loss below the low of the bullish candle.

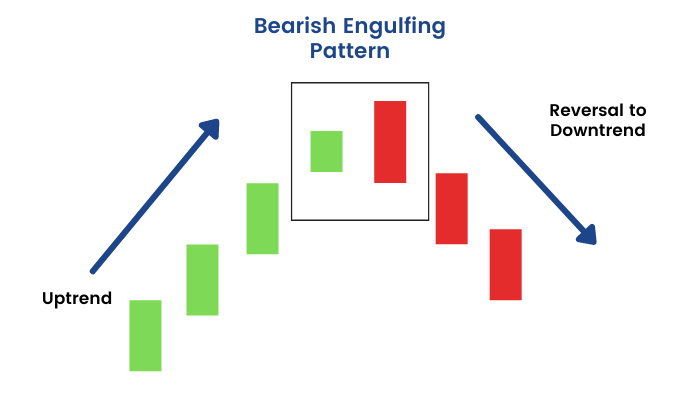
Bearish engulfing pattern
Bearish engulfing pattern consists of;
- Is a bullish candle
- Is a bearish candle that engulfs the bearish candle.
This pattern can be seen at the end of an uptrend.
It signals a trend reversal, which is a downtrend in the market.
It also appears in downtrends sometimes.
We have to take a short position below the low of the bearish candle and put a stop loss above the high of the bearish candle.
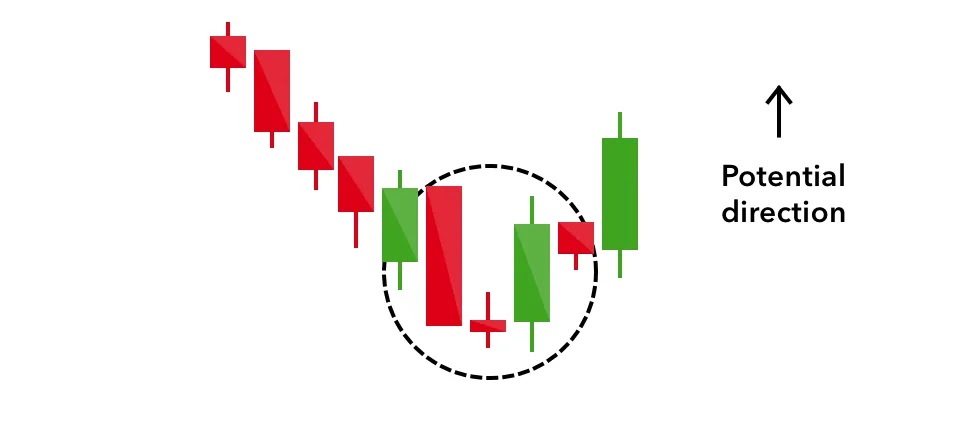
Tweezer bottom
The tweezer bottom pattern comprises two candles;
- Bearish candle
- Bullish candle
and has two equal bottoms.
It is a bullish trend reversal pattern.
It can be found at the bottom of a temporary bottom of a bearish trend.
It is confirmed when the next candle is a bullish candle.
It indicates a short-term bullish trend.
We have to take a long position when the prices rise above the higher high of the previous two candles and put a stop loss at the bullish candle low.

Neutral pattern
.A neutral candlestick pattern indicates an uncertain or neutral period for buyers and sellers in the market. It suggests that market players are uncertain and that neither side has a clear edge. These patterns signal that the trend may be reversing or consolidating and point to a lack of a strong bullish or bearish emotion in the market. One of the major neutral patterns is listed below:
- Spinning top
- Neutral doji
Spinning top pattern
The spinning top pattern consists of a short body between the longer upper wick and lower wick.
It is a neutral pattern as it shows a bullish or bearish trend.
In this pattern, the closing price comes very close to the opening price.
It indicates indecisiveness, so it’s wise to wait before taking any trading actions.
Pay a closer look at the follow-up prices and the volume associated with the spinning top pattern.

Neutral Doji
The body of the neutral Doji is a candlestick with a practically invisible body in the middle and similar-length wicks on the top and bottom.
This pattern will appear when bullish and pessimistic emotions are equally balanced.
You should pay particular attention to it when it forms at the support/resistance zone.
The market is in an unstable state at the time, which is the reason. Price will change direction or leave the support/resistance zone.

Other major trend reversal patterns are;
- Three outside up
- Three outside down
- Three inside up
- Three inside down
You can check our blogpost on
Three outside and inside candlestick patterns to know more.
Please have a look.
Feel free to comment your reviews about this post.
Pingback: what is a candlestick pattern | Guide for beginners - Learn Technical Analysis
Pingback: Hammer candlestick: Meaning, Types and How to trade with it